Part three of our introduction to seismology series is an exercise about the Modified Mercalli Intensity scale which is used by seismologists to determine the magnitude and epicenter of earthquakes of the past.
Before you Begin
Make sure you understand Earthquake! Parts 1 & 2 before tackling this challenge!
Introduction
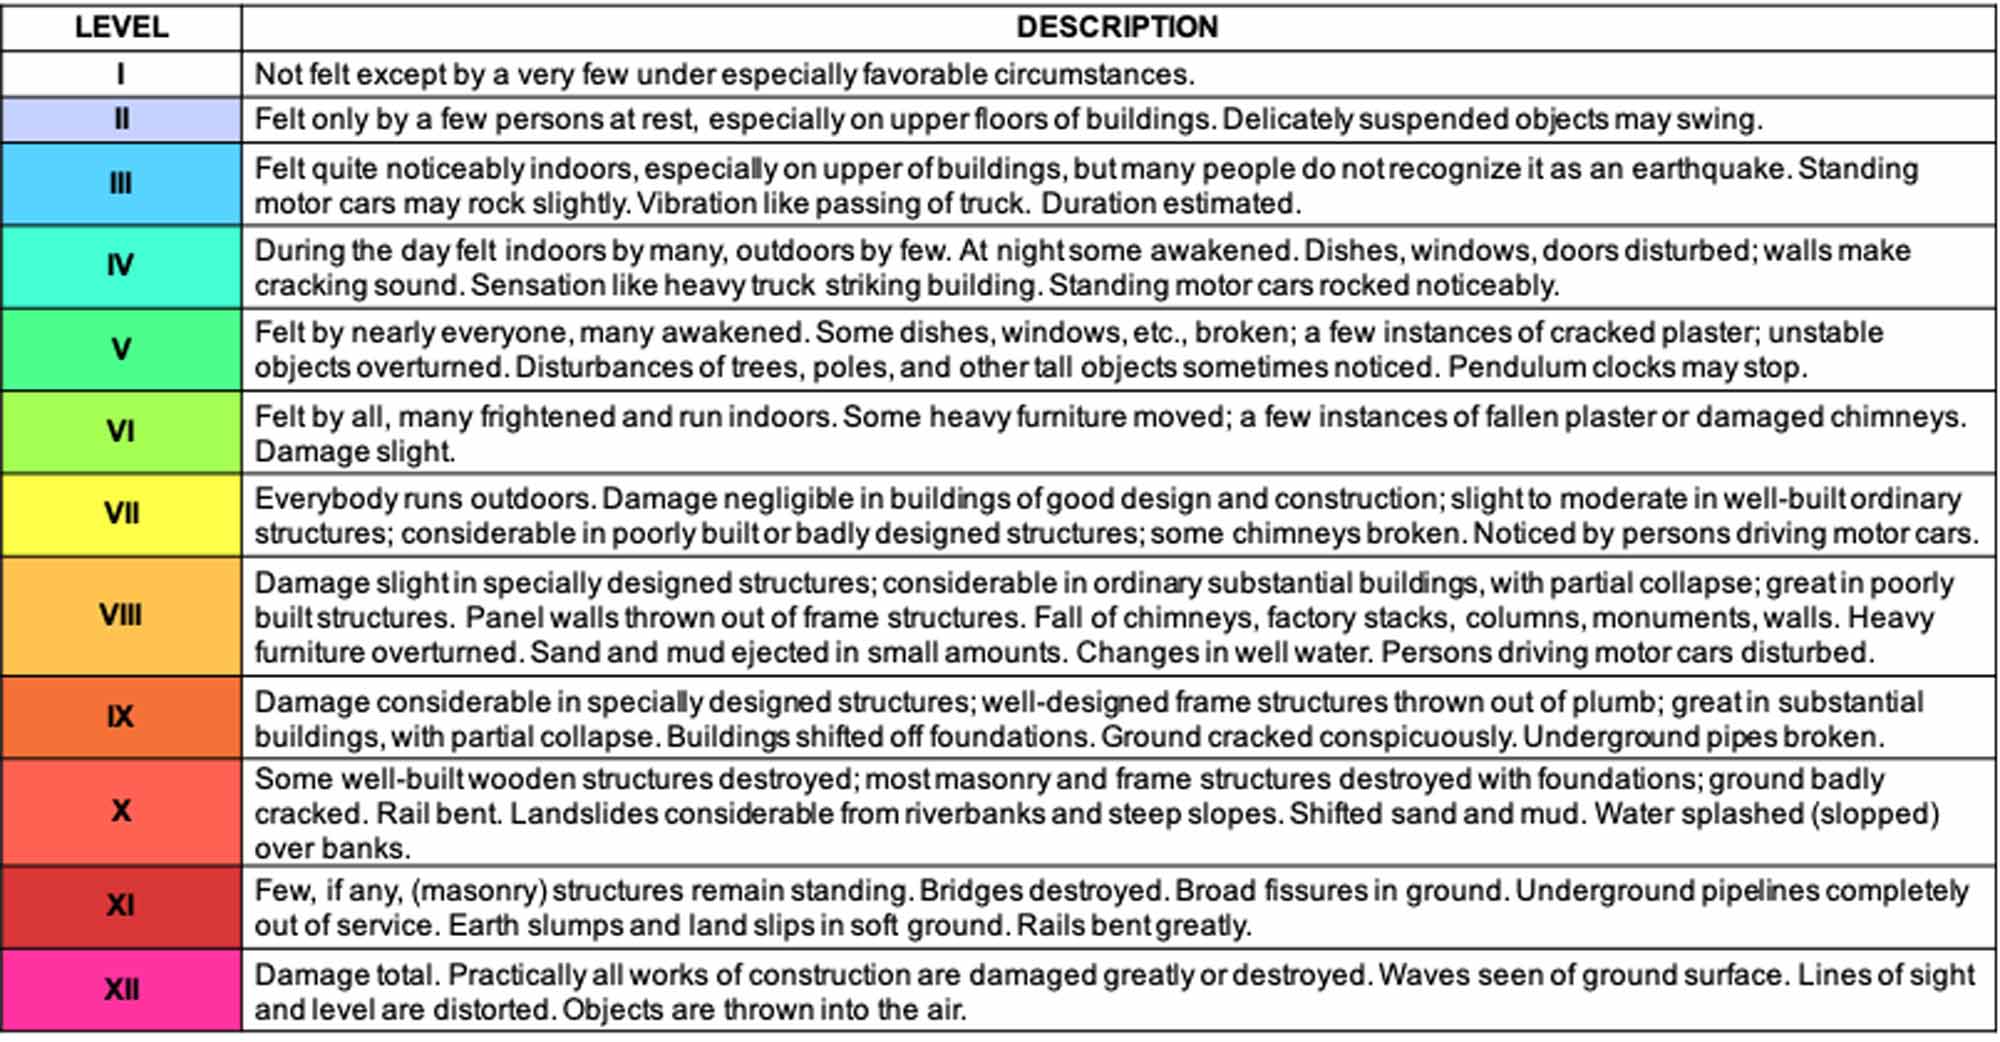
The Modified Mercalli Intensity Scale provides scientists with a method to quantify the shaking generated by an earthquake, as experienced at any point at the earth’s surface. The scale was developed at the turn of the century by the Italian volcanologist G. Mercalli, and subsequently revised by American seismologists H.O. Wood and F. Neumann in the 1930s. It is a 12-point scale, ranging from sites that experience barely perceptible vibration (MM I) to those that experience total devastation (MM XII). Note that the scale is based on vibration experienced at a particular site. Thus, in contrast to the Richter Magnitude scale, which assigns a single value to represent the overall size of an earthquake, the intensity values for a given quake range from site to site.
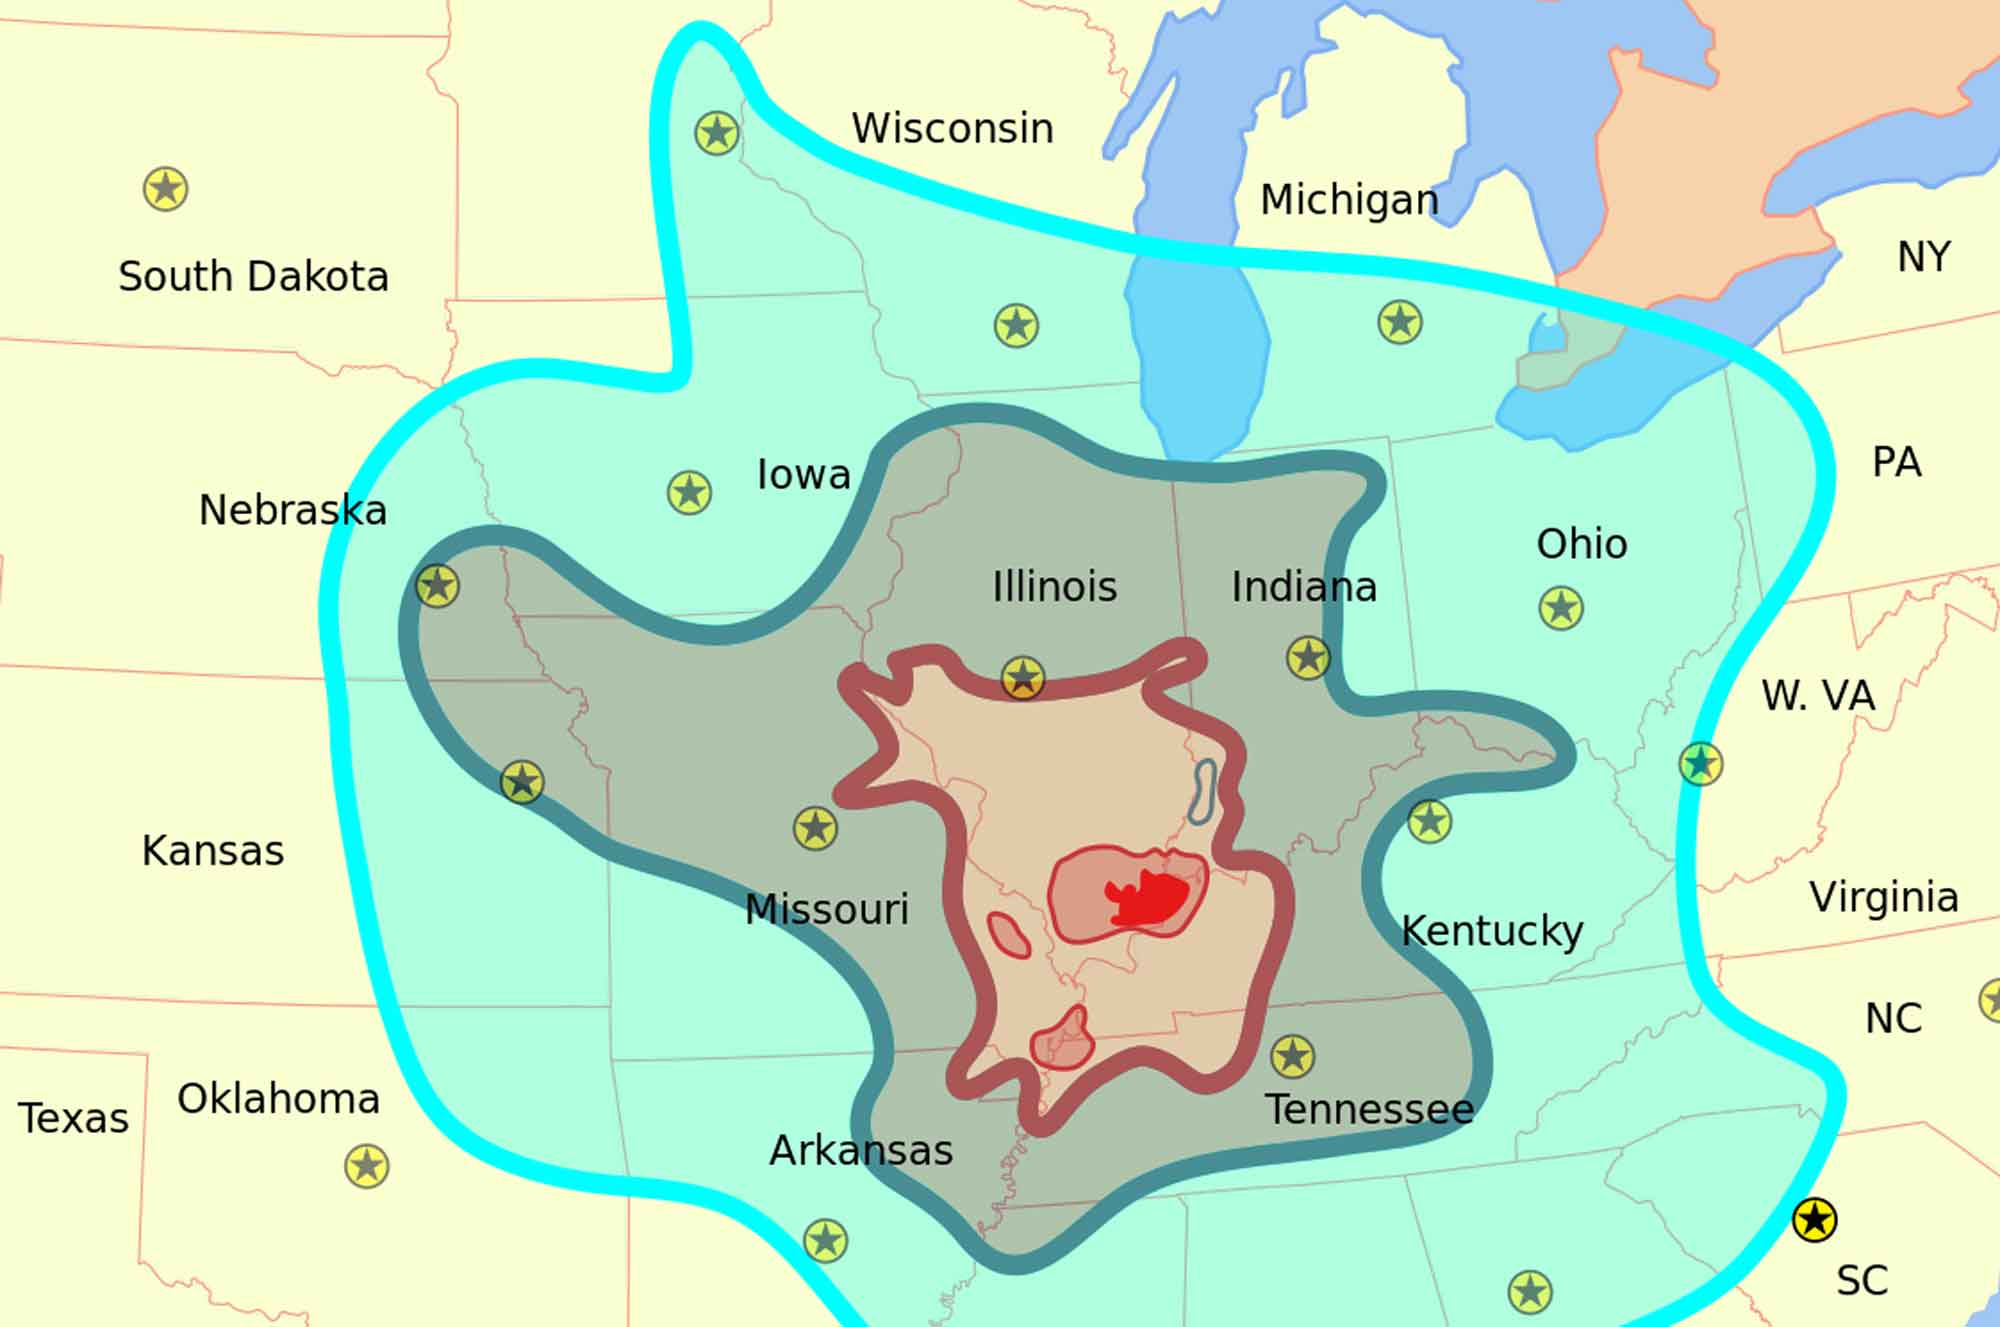
The intensities experienced at different sites depend primarily on the distance from the source to each site. The areas of equal intensity, referred to as isoseismals, tend to form irregular bullseye patterns, with the center of the bull’s eye, and the highest intensities, experienced at or near the earthquake epicenter. The Mercalli scale is particularly useful for comparing modern earthquakes with those that occurred before the era of seismographic recording (i.e., prior to 1900)-and for providing estimates of earthquake location, focal depth, and magnitude for these early events. Note that the effects on a particular area are highly dependent on the type of construction in the area. For instance, for a particular amount of shaking, unreinforced masonry (brick) buildings will experience much greater damage than wood-frame buildings in the same area. In order not to be biased by this effect, the Modified Mercalli scale attempts to allow for varying effects on different types of construction.
Activity
Historical documents indicate that a severe earthquake occurred somewhere in the Midwest, and the effects were felt over a wide area. In an effort to gather more information about the earthquake, you have compiled newspaper accounts of the events from many sources.
Step 1
Read the newspaper reports for each city and assign Mercalli intensity values to each of the reporting areas based on the classifications in Table 1 above.
Step 2
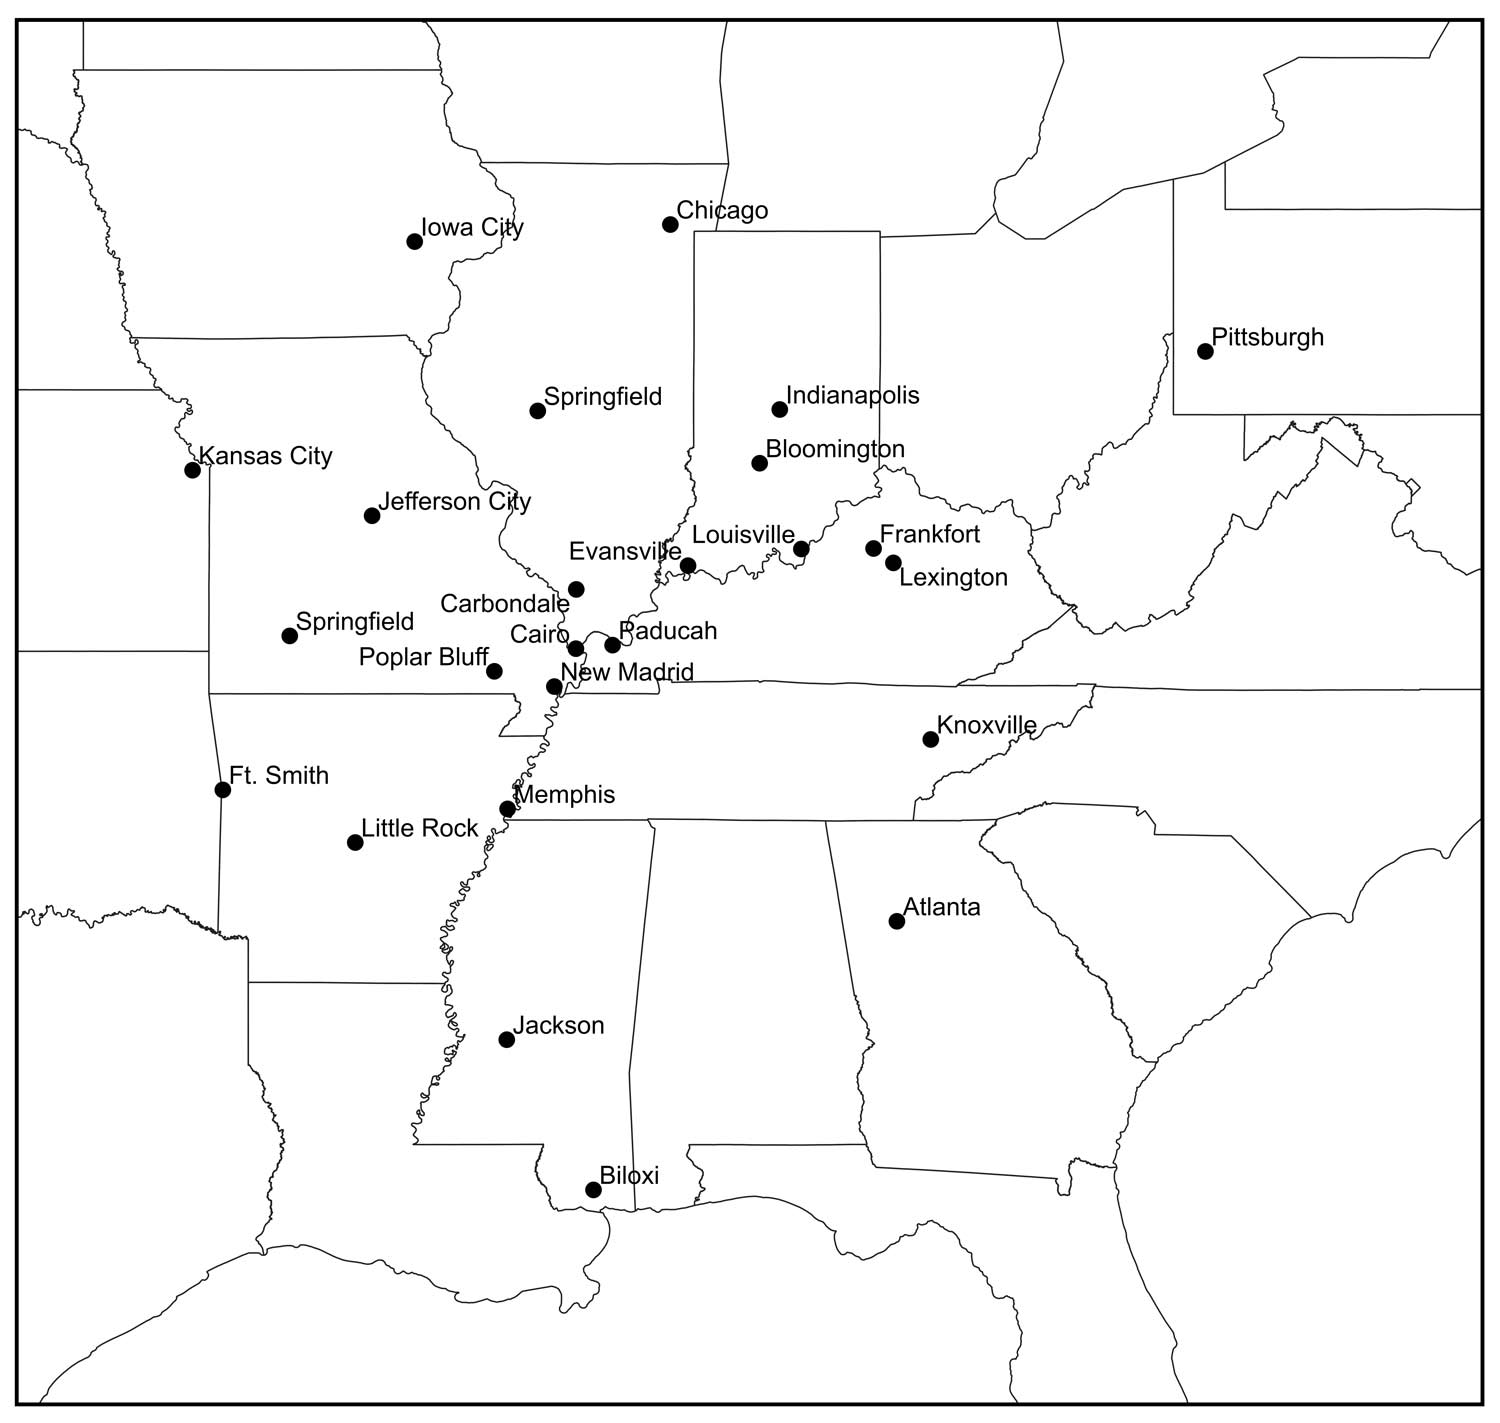
Indicate the intensity values on the map. The easiest way to do this is to print out the map and write the values by the dot for each city.
Download Map Worksheet

